


Screw this. -me, most of the time
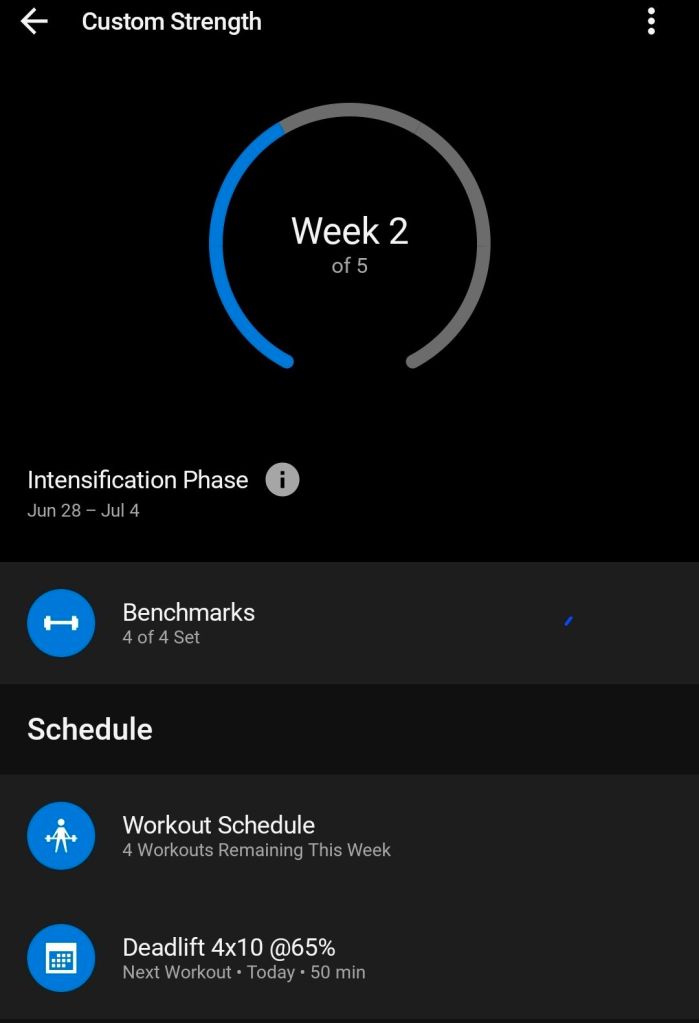
You see that thing that says “Intensification Phase”? Well, the me who created this plan to coincide the Intensification Phase with my Luteal Phase (pre-period week, for any non-ovary owners) was an absolute idiot. My stomach looks like I drink beer for a living, and I’m craving donuts. Nonstop. I feel like garbage, I look like garbage, and my bloated belly is both uncomfortable and very unfortunate for my workout goals. I hate this part.
So, instead of complaining, kidding, I’m doing that anyway, I suck it up and complete the hellish workout, for intensification purposes only. Might even throw in a good run, to round off the rage and loathing. But, wait, there’s more! After the intensification phase is a lovely phase titled the Realization Phase, which is a nice way to say you’re about to lift some heavy a** sh*t and you’ll be powerful and awesome and toned and kick butt all day! Just don’t die.
And another thing! This is the worst time to learn a new skill, such as data analysis using this fun little program called Power Bi. It’s not fun. I should have been able to plug in an Excel document, tell it to analyze the data, and a happy graphic pop out. Ha. What I got was a headache, convoluted data, and no happy graphic. I did receive a graph, but it didn’t have anything populated so it was basically blank and unhappy. Much like me.
Fortunately, the very next day post-Power Bi BS was fraught with zero Internet connection so everyone received a reprieve from work. Haha sort of. Not me though. I had a 2-day unexpected delivery of fitness equipment I think everyone forgot about. They said delivery in April, then May. Almost July is good. There was trash scattered from one end of the facility to the other. I walked 18,000 steps that day and, if I’d known what the day would bring, I would not have run!
But guess who didn’t have to Power Bi that day? This girl! Alas, I still have tutorials to watch. And data to analyze. Pie chart, anyone?
Welcome to PMS, friends. It will probably get worse before it gets better but maybe it’s just the hormones talking. Maybe I can make a graph of mood swings.
____________________________
I ask you –
How does the Power Bi thing work? I’m googling demos.
(The post Data Circles & Cycles first appeared here at Running on Fumes.)
© 2026 Running on Fumes


You must be logged in to post a comment.